| Using ICT to support mathematics in primary schools
Handy Graph |
| Using ICT to support mathematics in primary schools
Handy Graph |
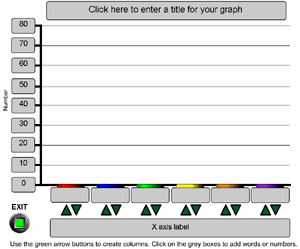 |
This is a simple program that draws block graphs. The examples shown are set in the context of a data handling activity How we travel to school
|
|
To change the title. Click on the title bar. Highlight the text by positioning the cursor at the start of the text. Click and hold the left mouse button while dragging the highlighter along the text. Press the Delete key. OR Position the cursor at the end of the text and press the backspace ( ) key until you have deleted the text. Type in your own text.
|
|
To change the x axis label. Click on the x axis label bar. Highlight the text by positioning the cursor at the start of the text. Click and hold the left mouse button while dragging the highlighter along the text. Press the Delete key. OR Position the cursor at the end of the text and press the backspace ( ) key until you have deleted the text. Type in your own text. |
| To change the scale on the y axis. Click on the number you want to change. If you click at the end of the number it will be highlighted. Press the Delete key OR Click in front of the number. The cursor will flash. Press the Delete key to delete one digit at a time. Type in your own values. |
|
| To label the columns Click in the box where you want to enter text. Type in your own text.
|
|
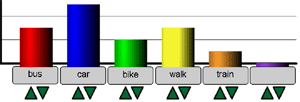 |
To alter the height of the columns To increase the height of the column click on the green up arrow.Each time you click the arrow the column will rise by half the distance between the grid lines. To delete the column press the green down arrow once.
|
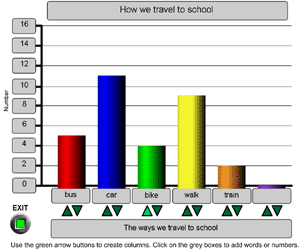 |
The finished graph |
| Press this button to exit the program. |
|